
Browsing Space
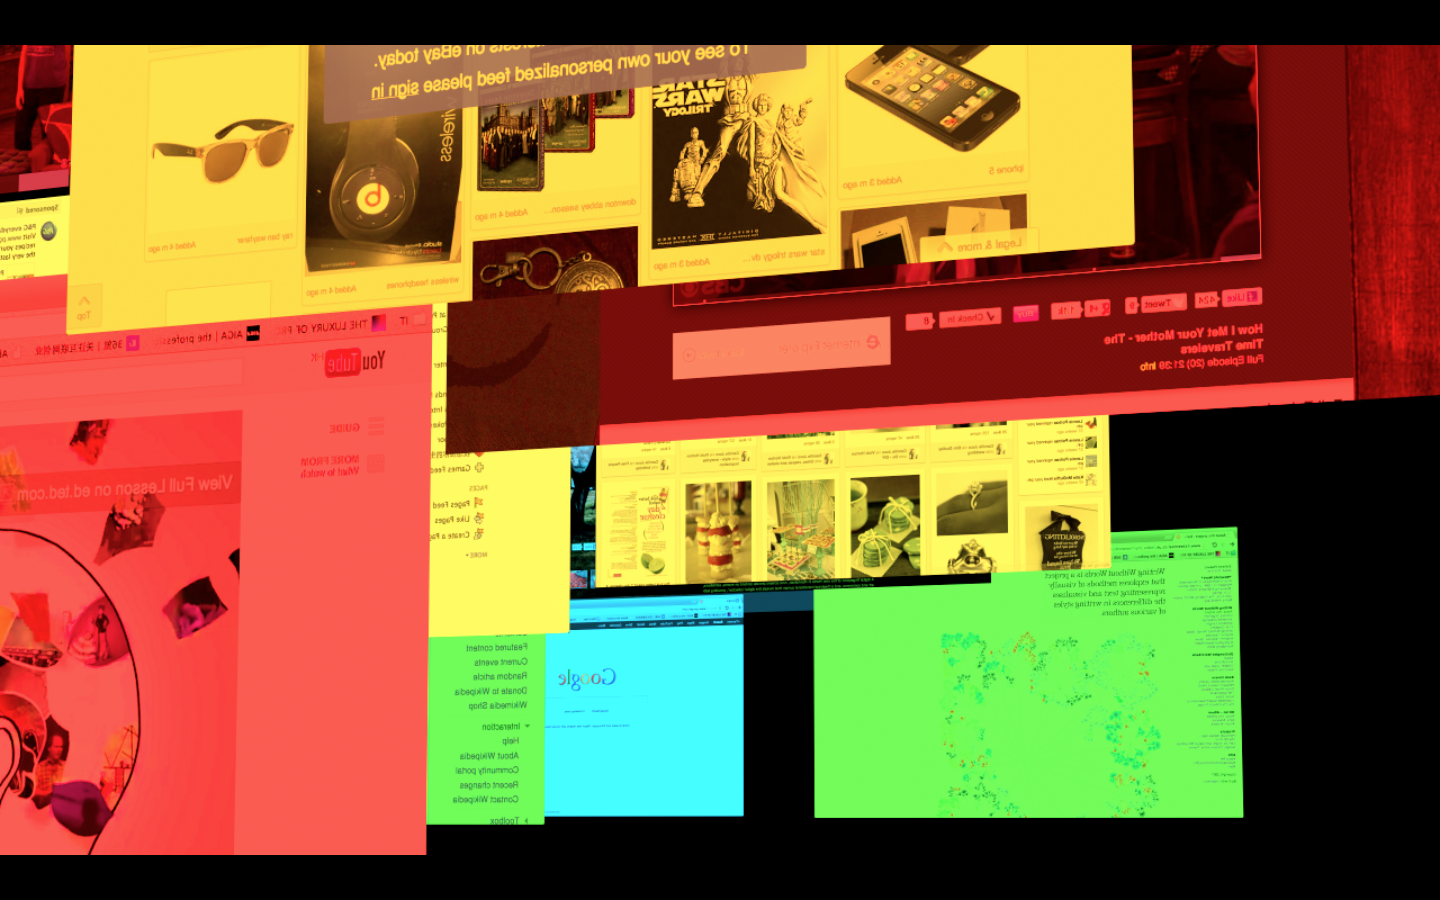
- Visualize One Week Web Browsers History
This project contains two pieces, a 30-foot long visualization of my one-week browser history, and a motion that illustrates different ways of viewing the Internet. In visualization, there are five groups, searching(blue), learning(green), social networks(yellow), entertainment(red), and shopping(orange). The length of bars represents the durations on web pages, and lines mean the hyperlinks.